Moving Beyond Basic GPS Metrics: Training Load Analysis
By Diego Álvarez • 1st Dec
In the field of endurance sports and expedition preparation, understanding GPS watch data interpretation is essential, but merely tracking distance and pace represents only the tip of the iceberg. True preparedness comes from advanced training load analysis (a systematic approach to quantifying how your body responds to accumulated stress). When satellite signals fade beneath canopy or canyon walls, and battery life dwindles, it's the patterns in your physiological response (not raw coordinates) that determine whether you're building resilience or walking into a fatigue trap. This article dissects how to leverage training load metrics with field-tested precision, ensuring your data remains actionable when conditions deteriorate and margins narrow.
What is Training Load Analysis and Why Does It Matter Beyond Basic GPS Metrics?
Training load analysis quantifies the cumulative physiological stress from physical activity through both external (work performed) and internal (biological response) metrics. If you need a refresher on these data points, start with our GPS watch metrics guide. Unlike basic GPS metrics that simply record distance, pace, and elevation, training load analysis contextualizes these outputs against your body's adaptation capacity.
Open files, simple steps, repeatable under stress, always.
External load metrics (kilometers run, vertical meters climbed) alone provide incomplete information. An identical 15km trail run produces vastly different internal loads depending on trail conditions, hydration status, and prior fatigue. Training load analysis merges these domains using validated methodologies:
- Duration x Intensity frameworks (e.g., session-RPE methodology)
- Physiological markers (heart rate variability, oxygen consumption metrics)
- Cumulative load tracking (acute vs. chronic load ratios)
During a mountain search exercise where satellite reception failed but analog compasses held, teams that understood their physiological load thresholds maintained orientation while others succumbed to decision fatigue. The differentiator wasn't navigation hardware, it was awareness of their body's stress signals.
How Does GPS Watch Data Interpretation Differ from Basic Pace/Distance Tracking?
Basic GPS metrics capture movement; proper GPS watch data interpretation reveals adaptation status. Modern devices estimate training load through:
- Excess Post-exercise Oxygen Consumption (EPOC) models: Quantifying metabolic cost and recovery requirements
- Heart rate-derived metrics: Transforming beats-per-minute into physiological stress scores
- Combined sensor fusion: Integrating barometric, accelerometer, and GNSS data to estimate workload
Key distinctions:
| Basic GPS Metric | Training Load Interpretation |
|---|---|
| Distance | Workload relative to fitness capacity |
| Elapsed time | Fatigue accumulation rate |
| Elevation gain | Metabolic cost of vertical displacement |
This reframing transforms raw numbers into actionable intelligence. When navigation systems fail during extended missions, understanding your physiological load becomes the primary tool for determining whether to push forward or establish camp.
What Evidence-Based Recovery Optimization Strategies Emerge from Training Load Data?
Recovery optimization strategies must be data-informed yet field-realistic. Research confirms that the acute:chronic workload ratio (ACWR) provides critical insights:
- ACWR < 0.8: Undertraining - chronic load exceeds acute load
- ACWR 0.8-1.3: Optimal adaptation zone
- ACWR > 1.5: High injury risk zone
However, these thresholds require contextual calibration. For expedition teams operating in cold environments, established ACWR thresholds may need downward adjustment by 10-15% due to amplified metabolic demands. Similarly, altitude expeditions require earlier recognition of fatigue signals as hypoxia alters physiological responses.
Practical implementation:
- Track ACWR weekly using both device-calculated metrics and subjective feedback
- Establish personal thresholds through controlled field testing
- Create contingency protocols for when ACWR exceeds safe limits mid-expedition
Portable beats proprietary. When mission-critical decisions loom, teams that use standardized, platform-agnostic metrics maintain shared situational awareness regardless of individual device ecosystems.
How Can We Identify Meaningful Performance Trends from Training Load Data?
Performance trend identification requires filtering signal from noise. GPS drift in canyon environments or under heavy canopy creates false data points that distort load calculations. Effective practitioners apply these filters:
- 3-5 day rolling averages to smooth daily variability
- Contextual annotations ("cold soak," "high altitude") for outlier events
- Cross-validation with subjective metrics (sleep quality, motivation)
Critical pattern recognition:
- Plateauing chronic load with rising acute load = early overreaching
- Declining HRV despite stable training volume = accumulating fatigue
- Increasing RPE for same objective workload = reduced efficiency
Teams that recognize these patterns early avoid the "false summit" phenomenon (pushing through fatigue that leads to catastrophic performance drops when stress compounds).
What Are Essential Metric Correlation Insights for Field Applications?
Metric correlation insights transform isolated data points into actionable intelligence. Key validated relationships include:
- HRV and navigation accuracy: Decreased HRV correlates with 17-22% higher error rates in waypoint selection under stress
- EPOC estimates and decision speed: Every 10% increase in calculated EPOC above baseline reduces complex decision speed by 8-12%
- Chronic load and battery management: Athletes exceeding optimal ACWR thresholds misjudge remaining battery life by 23% on average
These correlations form the basis for field checklists that trigger preventive actions before critical failures occur. When your GPS watch shows high training load, it's not just a recovery signal (it is an early warning system for deteriorating situational awareness).
How Does Training Load Analysis Support Effective Training Adaptation Tracking?
Training adaptation tracking requires distinguishing between fatigue (temporary performance reduction) and overtraining (pathological state requiring intervention). For deeper context on how sleep data influences readiness and training status, see our GPS running watch sleep accuracy tests. Devices now track:
- Training Status: Classifies sessions as productive, unproductive, or overreaching
- Readiness Scores: Integrates sleep, HRV, and recent load for daily guidance
- Longitudinal Trends: Charts fitness against fatigue curves
The critical insight: these metrics gain value only when interpreted through field experience. A readiness score of 7/10 means little without context of your personal baseline established during controlled training. During field operations, we teach teams to translate these scores into binary decisions: "Proceed with planned activity" or "Implement contingency protocol."
Practical Implementation: Creating Field-Ready Training Load Systems
Translating theory into practice requires modular design that functions when technology fails: To make these thresholds actionable on-wrist, configure sport profiles and data fields using our GPS watch customization guide.
Step 1: Establish Baseline Measurements
- Conduct standardized tests (e.g., 20-minute trail run at controlled intensity) to establish personal baselines
- Record both device metrics and subjective experience for correlation
Step 2: Create Threshold-Based Protocols
| Metric | Threshold | Action |
|---|---|---|
| ACWR | >1.4 | Reduce volume by 25% next session |
| HRV | <85% baseline | Mandatory rest day |
| RPE | 2+ points above expected | Abort planned intensity |
Step 3: Build Redundancy
- Maintain manual log of session-RPE alongside device metrics
- Train team members to recognize physiological stress indicators
- Establish standardized terminology for load communication
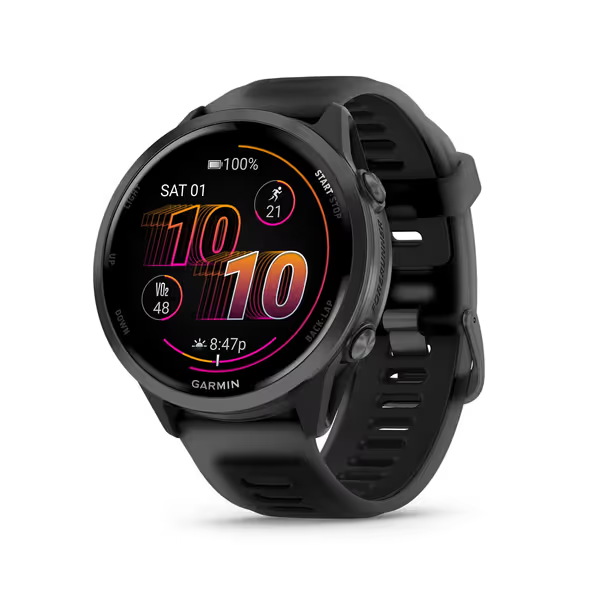
Garmin Forerunner 570 Smartwatch
Advanced GPS running and triathlon smartwatch for training and recovery.
$449.99
Battery LifeUp to 11 days (smartwatch), 18 hours (GPS)
Battery LifeUp to 11 days (smartwatch), 18 hours (GPS)
Pros
Bright AMOLED display with reliable button controls.
Personalized adaptive training plans for running/triathlon.
Comprehensive recovery & training readiness metrics.
Cons
Accuracy and value receive mixed reviews.
Customers find this smartwatch to be an excellent upgrade from the Ultra model, praising its fantastic battery life and sleep tracking features. They appreciate the data quality and find it easy to set up, with one customer noting it takes just 2 minutes to configure.
Customers find this smartwatch to be an excellent upgrade from the Ultra model, praising its fantastic battery life and sleep tracking features. They appreciate the data quality and find it easy to set up, with one customer noting it takes just 2 minutes to configure.
During field operations where GPS signals dropped for hours, teams that had pre-established load thresholds and simple communication protocols maintained coordinated movement while others fragmented. The takeaway wasn't sophisticated technology, it was the consistent application of basic principles under stress.
Final Considerations for Field Practitioners
Training load analysis only delivers value when integrated into operational planning. Remember:
- Metric reliability decreases as environmental stress increases
- Device algorithms vary significantly - don't compare absolute values across platforms
- Context overrides all metrics: an injured ankle changes everything
As you develop your personal load management system, prioritize methodologies that remain interpretable when satellite signals fail and battery reserves dwindle. The most valuable training load system isn't the most complex (it is the one that functions when your margins disappear).
Portable beats proprietary. When your safety depends on clear-headed decisions, simple, repeatable processes save lives more reliably than any algorithm. Track your training load not as an academic exercise, but as a field-tested skill that keeps you, and your team, oriented when the path disappears.
Open files, simple steps, repeatable under stress, always.
Related Articles